Monitor TUI
claude-code-proxy serve opens the monitor when stdout is an interactive terminal. The same process runs the HTTP listener.
To run the proxy as a service and attach the dashboard separately:
# Run this under your service manager, or leave it in another terminal.claude-code-proxy serve --no-monitor
# Attach from any terminal; repeat for additional dashboards.claude-code-proxy monitor
Use claude-code-proxy monitor --url http://127.0.0.1:19999 for a different port. Without --url, the port follows the usual proxy configuration. The attached dashboard reads the running service’s existing history; it does not start a proxy or need provider credentials.
In an attached dashboard, q and Ctrl-C detach immediately and leave the service running. Multiple dashboards can attach independently. If the service becomes unavailable, the dashboard marks its last snapshot as stale and reconnects automatically. Network polling runs outside the terminal event loop.
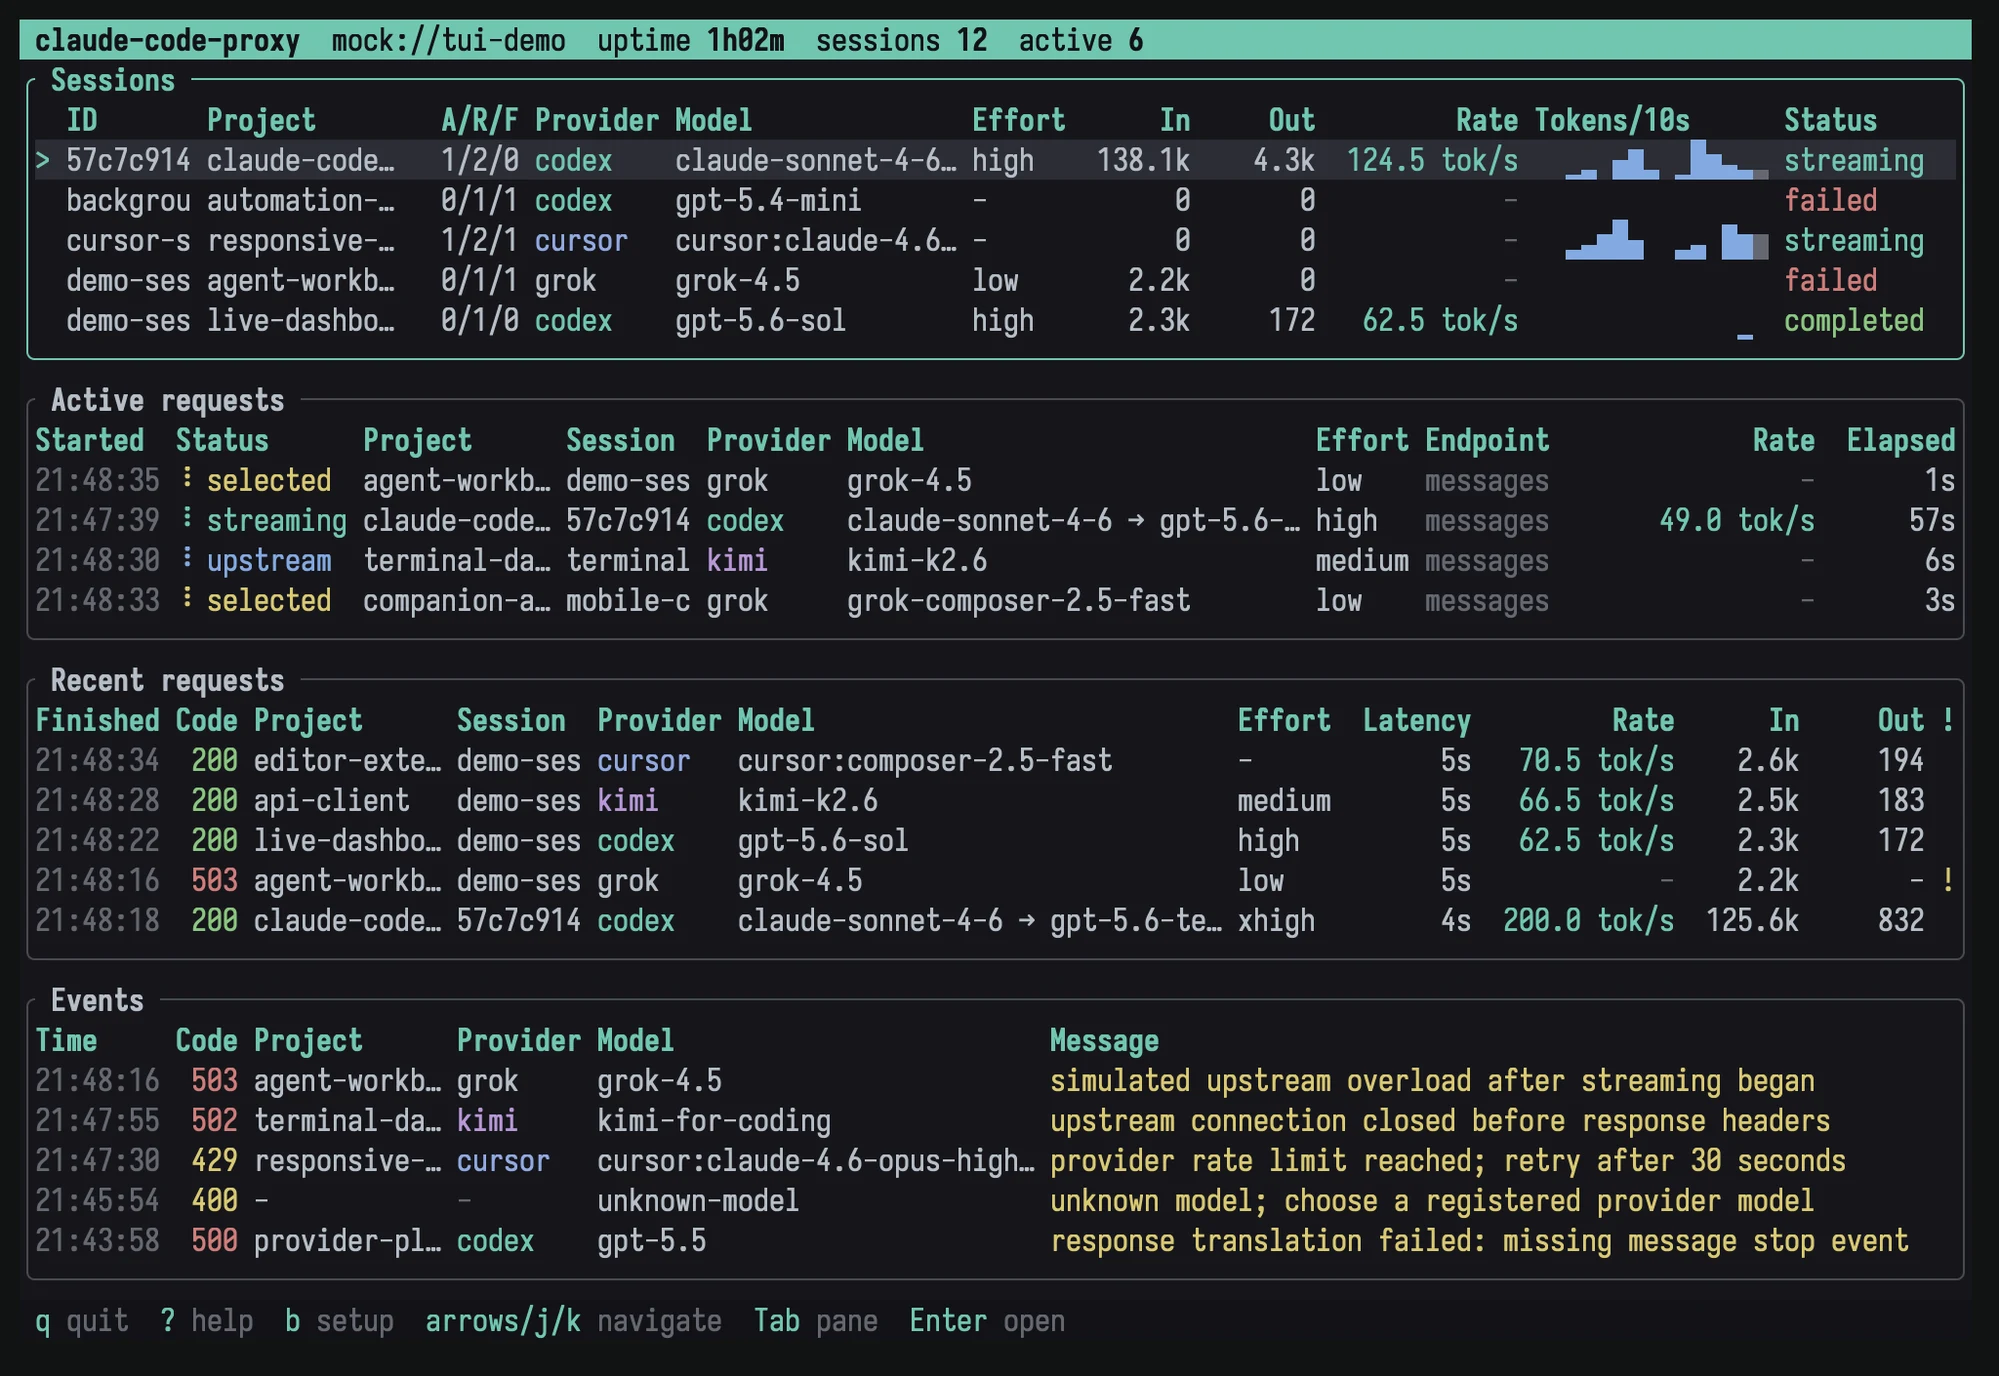
What the monitor shows
Section titled “What the monitor shows”- Sessions grouped by Claude Code session ID and project
- Active request lifecycle and selected provider or model
- Recent requests, HTTP status, elapsed time, and errors
- Input and output token totals
- Output throughput based on matched upstream timing and cumulative usage samples
- Paths to traffic captures when capture is enabled
- Configuration overrides and a ready-to-copy Claude Code setup
Keyboard controls
Section titled “Keyboard controls”| Key | Action |
|---|---|
Tab, ←, → |
Change focused pane |
j, k, ↓, ↑ |
Move selection |
Enter |
Open session or request details |
Esc |
Close details or an overlay |
? |
Toggle shortcut help |
b |
Toggle the setup overlay |
q |
Detach an attached dashboard; in the built-in dashboard, confirm proxy shutdown |
Ctrl-C |
Detach an attached dashboard; in the built-in dashboard, start shutdown (press again to force exit) |
The request table changes columns as the terminal width changes.
Plain logs
Section titled “Plain logs”Use plain output when the process runs under a service manager, in CI, or through a pipe:
claude-code-proxy serve --no-monitorNon-terminal stdout also selects plain mode. CCP_LOG_STDERR=1 mirrors JSONL log events to stderr in plain mode.
Plain mode retains monitor accounting even with no dashboard attached. On Unix, SIGTERM starts graceful proxy shutdown; Ctrl-C does the same. The service manager owns the process lifetime.
Demo mode
Section titled “Demo mode”Explore the full interface without binding a port or using provider credentials:
claude-code-proxy demoThe deterministic simulation covers active, successful, and failed requests across providers, projects, throughput states, and responsive layouts.
Background service
Section titled “Background service”A Homebrew installation can run at login:
brew services start claude-code-proxyService output lives in ~/.local/state/claude-code-proxy/service.log on macOS and Linux. The structured proxy.log shares the state directory. Provider login remains an interactive one-time command.
Run claude-code-proxy monitor to inspect that service. The monitor endpoint only accepts loopback connections, even if the inference listener binds a LAN address. For a service on another machine, forward its port with SSH and point monitor --url at the local end of the tunnel.
History remains in the proxy’s memory and resets when the proxy restarts. The dashboard polls snapshots every 250 ms and displays server-computed durations and throughput. The attached setup overlay describes its connection; provider setup remains with the service and its built-in dashboard.